The Shwett platform
Unified 3D monitoring and mapping of your IT system
Shwett brings IT monitoring and infrastructure mapping together in a single 3D interface. Visualize your devices, their dependencies and uplinks, detect SPOFs and get alerted before an incident affects your users.
Why 3D changes monitoring
Holistic
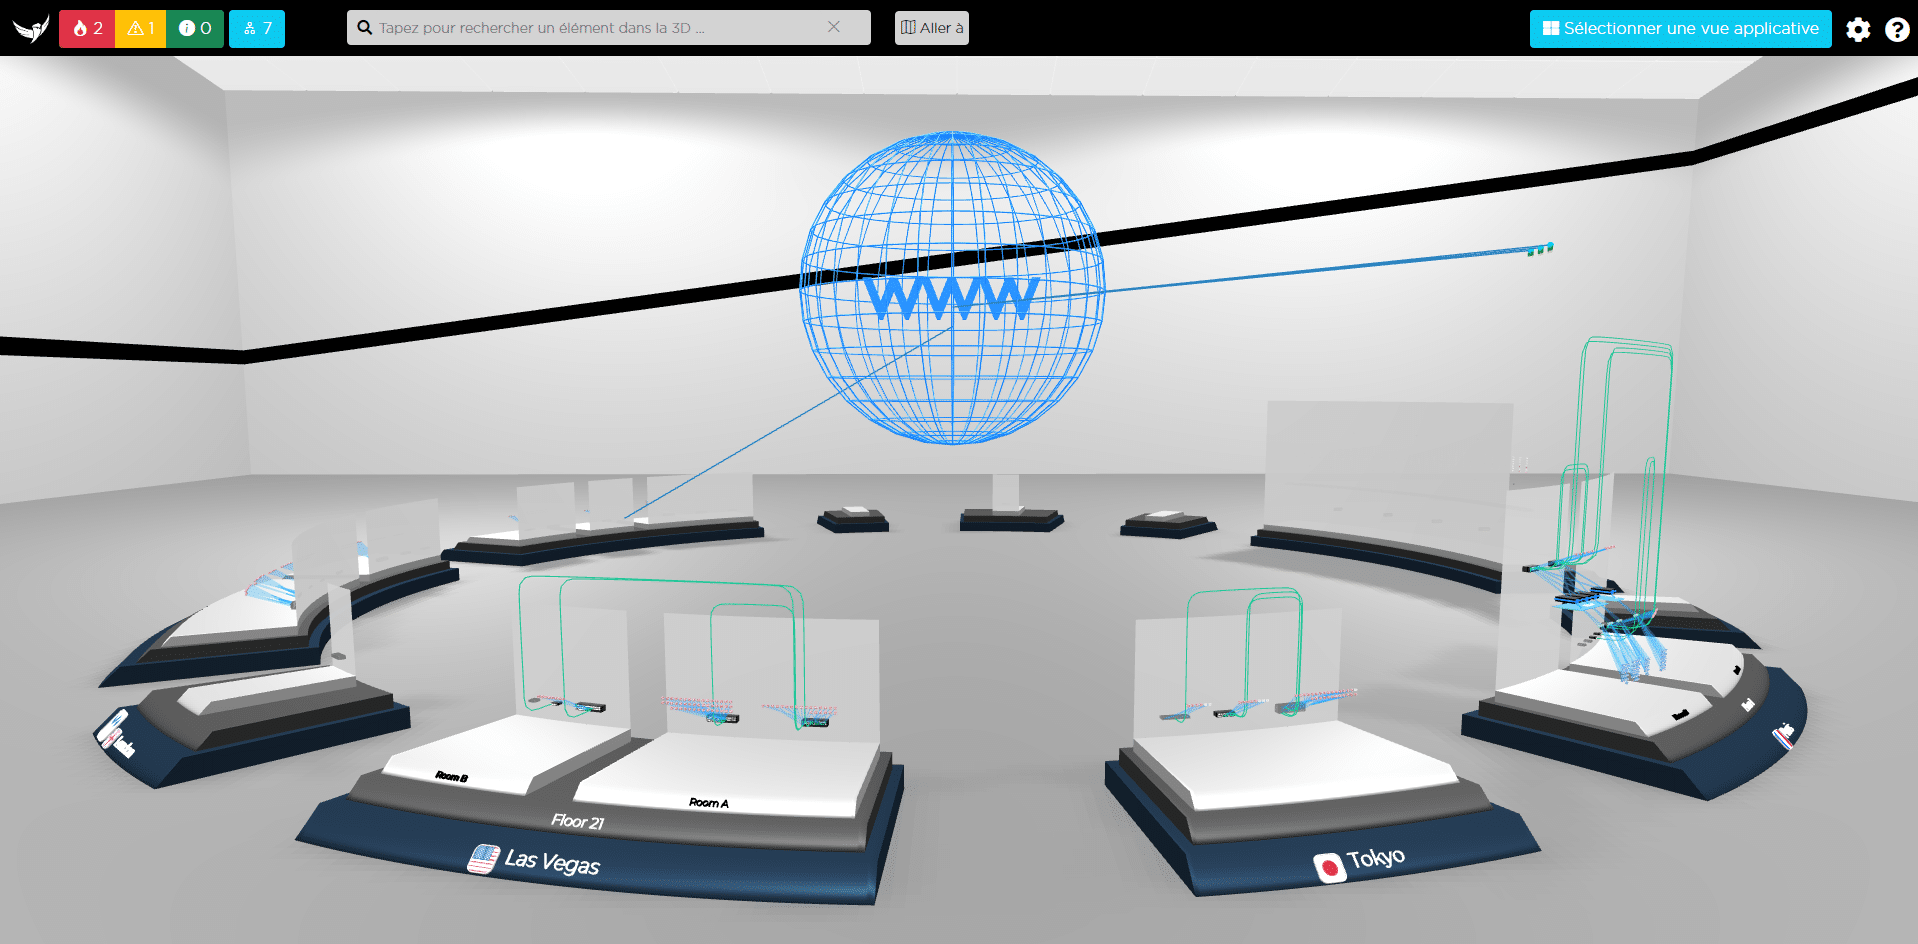
Your infrastructure modeled in 3D, organized by sites, floors and rooms: a global view of your devices and how they connect.
Intelligent
Automatic device typing, network discovery and three alert levels with automatic notifications.
Agile
Turnkey deployment in minutes, agentless and SaaS: automatic updates and access from anywhere.
Automatic 3D mapping
Once installed, the Shwett probe discovers your infrastructure with no prior configuration. Using SNMP and hypervisor APIs, it detects every switch, server, vSwitch and VM, then rescans the network regularly to add new elements.
- Automatic detection and typing of physical and virtual assets
- Automatic modeling of dependencies and uplinks
- Detection of single points of failure (SPOF)
- Logical views: site, floor, room, cluster, application scope
- Updated every two minutes
Monitoring and performance analysis
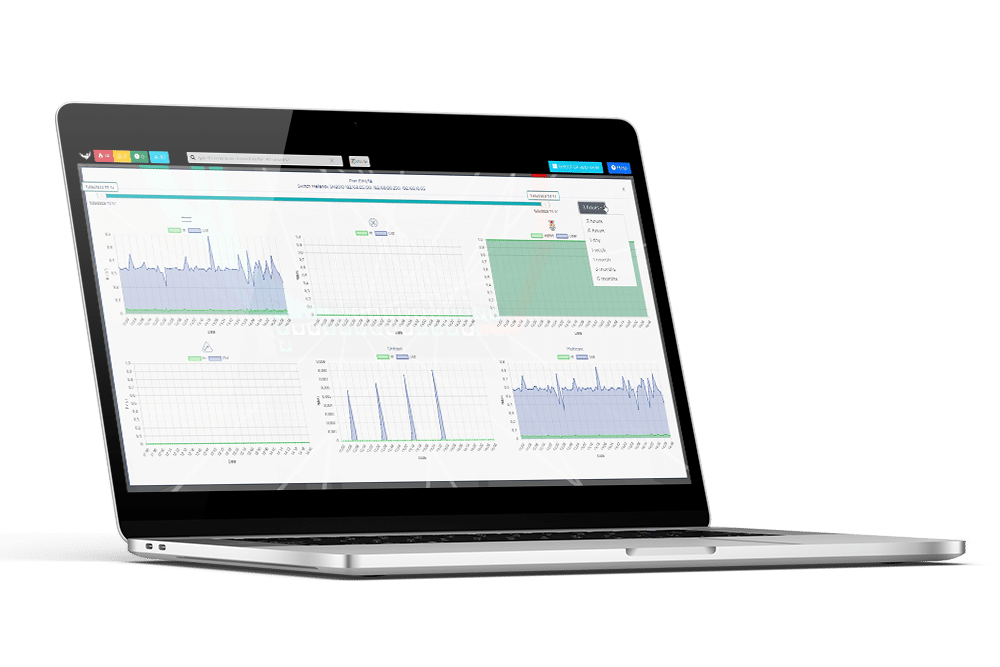
Analyze your devices’ performance directly in the 3D view, without switching tools.
- Network ports: in/out traffic, discarded or error packets
- Servers and VMs: CPU, RAM and disk usage
- Workstations: CPU, RAM and storage charts
- Printers: ink and paper levels
- Web services: URL availability checked every 2 minutes
Smart alerting
The probe polls your infrastructure every two minutes to detect anomalies as fast as possible: CPU, RAM, disk or bandwidth saturation, error packets, port down…
Three alert levels
Danger (red), Warning (orange) and Info (green), shown directly on the affected element in the 3D view.
Customizable thresholds
Thresholds are set by default at deployment, then adjustable to your own monitoring KPIs.
Notifications
Get alerts where your teams work: email, Microsoft Teams or Slack.
Application monitoring
Create views per business application from the Shwett console and display the infrastructure behind your critical applications in the 3D space: switches, servers, VMs, network communication chains and processes.
AI virtual assistant
Prepare interventions faster with saved or custom AI queries, built-in documentation for each asset and direct access to management interfaces from the 3D view.
Monitored elements
Physical assets
- Servers
- Storage (NAS, arrays)
- UPS
- Printers
- Workstations
Virtual assets
- VMs
- vSwitches
- Hypervisors (VMware, Nutanix)
- Web services
Network
- Switches and routers
- Uplinks
- Dependencies
- Network ports
Ready to see your IT system in 3D?
Deploy the probe in 30 minutes and explore your infrastructure free for 14 days.